Fig. 6
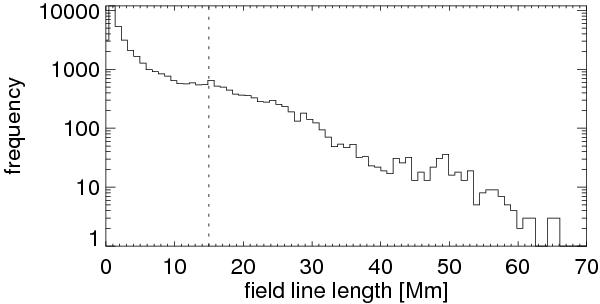
Top panel: histogram shows the distribution of field line length in the domain respecting the periodic boundaries. Equally distributed at z = 0 have been selected for the tracing algorithm 2562 starting points. Vertical dotted line depicts the local maximum at 15 Mm.
Current usage metrics show cumulative count of Article Views (full-text article views including HTML views, PDF and ePub downloads, according to the available data) and Abstracts Views on Vision4Press platform.
Data correspond to usage on the plateform after 2015. The current usage metrics is available 48-96 hours after online publication and is updated daily on week days.
Initial download of the metrics may take a while.