Free Access
Fig. 5
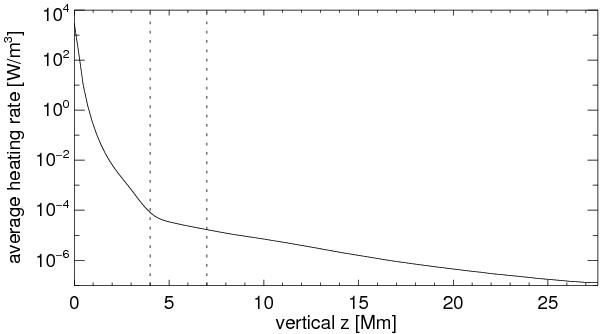
Horizontally averaged heating rate per unit volume for one snapshot. In the upper part above 4 Mm the average heating rate drops exponentially with an almost constant scale height of about 5 Mm. Vertical dotted lines as in Fig. 3.
Current usage metrics show cumulative count of Article Views (full-text article views including HTML views, PDF and ePub downloads, according to the available data) and Abstracts Views on Vision4Press platform.
Data correspond to usage on the plateform after 2015. The current usage metrics is available 48-96 hours after online publication and is updated daily on week days.
Initial download of the metrics may take a while.