Fig. 4
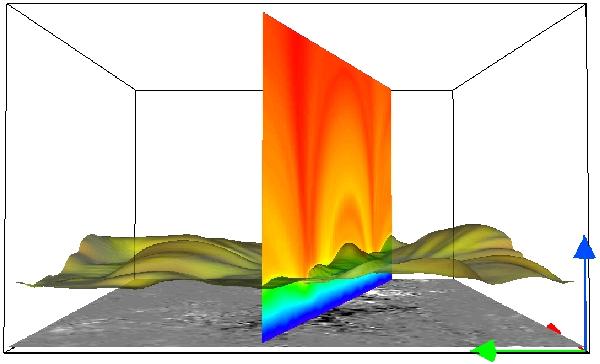
Visible impression of transition region height. Isosurface of the temperature at log T/[K] = 5.0 and a vertical cut through the domain showing the density above the main magnetic polarities (gray-scale bottom picture). Color code of the isosurface and the plane indicates logarithmic densities. A dense coronal loop is visible in the vertical cut. The domain shown is 50 × 50 × 30 Mm.
Current usage metrics show cumulative count of Article Views (full-text article views including HTML views, PDF and ePub downloads, according to the available data) and Abstracts Views on Vision4Press platform.
Data correspond to usage on the plateform after 2015. The current usage metrics is available 48-96 hours after online publication and is updated daily on week days.
Initial download of the metrics may take a while.