Fig. 15
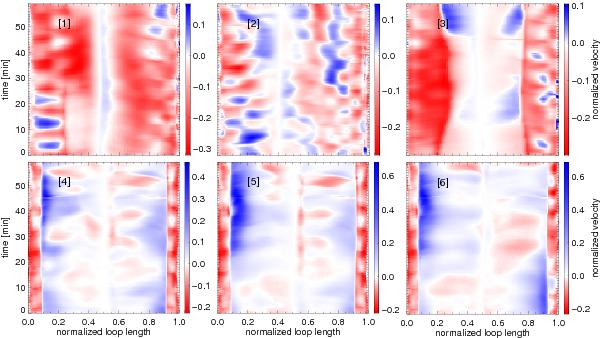
Same as in Fig. 13, but showing vertical component of flow velocity parallel to magnetic field lines. The velocity is divided by the local sound speed. The color table varies for each field line and is given on the right hand side of each panel. Red colors indicate down flows and blue colors up flows accordingly. In general, flows are subsonic.
Current usage metrics show cumulative count of Article Views (full-text article views including HTML views, PDF and ePub downloads, according to the available data) and Abstracts Views on Vision4Press platform.
Data correspond to usage on the plateform after 2015. The current usage metrics is available 48-96 hours after online publication and is updated daily on week days.
Initial download of the metrics may take a while.