Free Access
Fig. 10
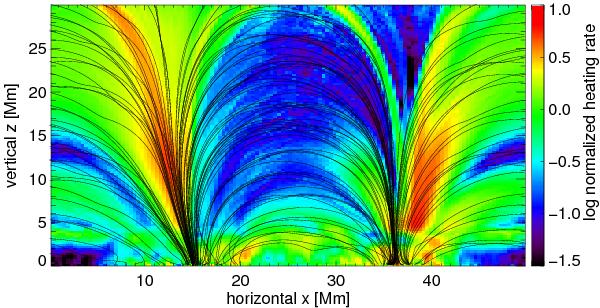
Integrated heating rate as in Fig. 9, but overplotted are the magnetic field lines in the slab projected onto the x-z plane. Starting points for the tracing algorithm are equally distributed in the 3D slab.
Current usage metrics show cumulative count of Article Views (full-text article views including HTML views, PDF and ePub downloads, according to the available data) and Abstracts Views on Vision4Press platform.
Data correspond to usage on the plateform after 2015. The current usage metrics is available 48-96 hours after online publication and is updated daily on week days.
Initial download of the metrics may take a while.