Free Access
Fig. 7
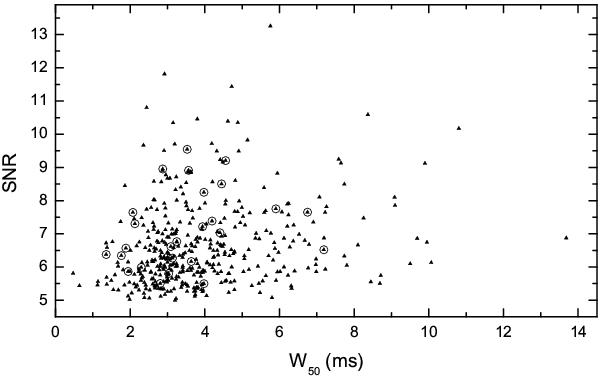
Plot of SNR versus W50 of 423 detected bursts from RRAT J1819 − 1458. The plot displays that the burst of the highest SNR (13.3) has a medium W50 (5.7 ms), whereas the burst with the largest W50 (13.7 ms) has a comparatively low SNR (6.9). Circled dots are the counterparts of bimodal bursts.
Current usage metrics show cumulative count of Article Views (full-text article views including HTML views, PDF and ePub downloads, according to the available data) and Abstracts Views on Vision4Press platform.
Data correspond to usage on the plateform after 2015. The current usage metrics is available 48-96 hours after online publication and is updated daily on week days.
Initial download of the metrics may take a while.