Fig. 6
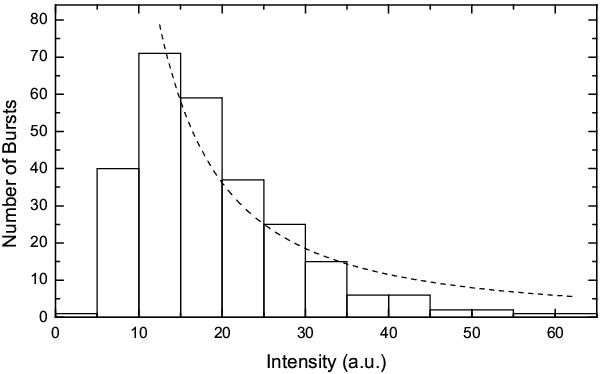
Flux intensity distribution of bursts detected from RRAT J1819−1458. The flux intensity distribution is generated by 266 detected bursts with SNR ≥ 6. The dashed curve line signifies that the intensity cumulative probability distribution is a power law. The power-law index α = 1.6 ± 0.2 is fitted from the numbers of bursts with intensities higher than 10.
Current usage metrics show cumulative count of Article Views (full-text article views including HTML views, PDF and ePub downloads, according to the available data) and Abstracts Views on Vision4Press platform.
Data correspond to usage on the plateform after 2015. The current usage metrics is available 48-96 hours after online publication and is updated daily on week days.
Initial download of the metrics may take a while.