Fig. 1
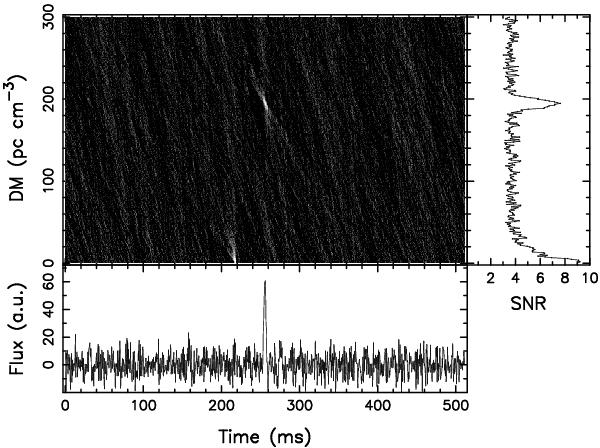
Diagnostic plot showing detected burst from RRAT J1819 − 1458 and RFI signal. The upper-left panel is a DM-time gray map generated by de-dispersing the signal with DM varying from 0.7 to 300.7 pc cm-3 in steps of 1 pc cm-3. The brightness of the plot indicates the amplitude at the corresponding position, and, the two bright marks at around DM = 195.7 and DM = 0 pc cm-3 represent the burst and RFI. The upper-right panel is a DM–SNR graph with two peak SNR values at around DM = 195.7 and DM = 0 pc cm-3, in which the SNR for each DM is calculated from the bin of maximum amplitude over 512 ms. The lower-left panel is a time series graph showing the amplitude (in an arbitrary unit) of each bin at DM = 195.7 pc cm-3, which clearly delineates a narrow burst profile at the center.
Current usage metrics show cumulative count of Article Views (full-text article views including HTML views, PDF and ePub downloads, according to the available data) and Abstracts Views on Vision4Press platform.
Data correspond to usage on the plateform after 2015. The current usage metrics is available 48-96 hours after online publication and is updated daily on week days.
Initial download of the metrics may take a while.