Fig. 6
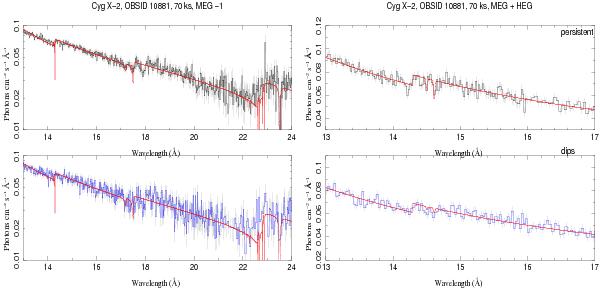
Left: broadband fit using a multi-component continuum model and the tbnew high-resolution absorption function to the MEG –1st order spectra of the persistent (top) and dip (bottom) emissions. The bandpass includes the Ne K edge at 14.29 Å (867 eV), the Fe L II and III edges at 17.2 Å (721 eV) and 17.5 Å (708 eV), and the O K edge at 22.89 Å (542 eV). Right: the local fit to the Ne K edge using a simple power law and an edge function with an energy fixed at 14.29 Å.
Current usage metrics show cumulative count of Article Views (full-text article views including HTML views, PDF and ePub downloads, according to the available data) and Abstracts Views on Vision4Press platform.
Data correspond to usage on the plateform after 2015. The current usage metrics is available 48-96 hours after online publication and is updated daily on week days.
Initial download of the metrics may take a while.