Fig. 9
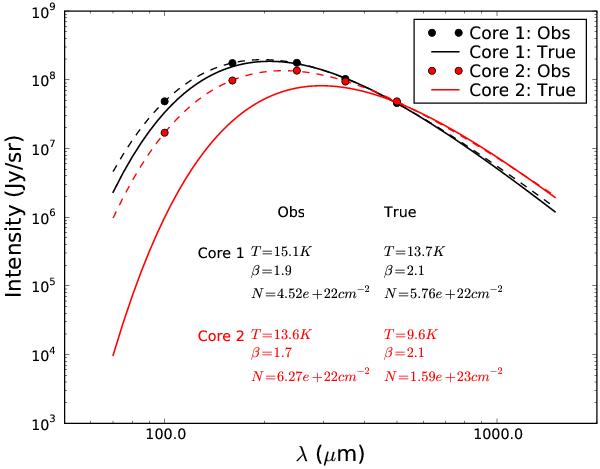
Model II: SEDs for the two cores (with radius = 20 pixels) that were marked with numbers 1 and 2 in Fig. 8. The “true” SEDs (see text) are drawn with continuous lines. The observed SEDs (dashed lines) are fits to five wavelengths 100, 160, 250, 350, and 500 μm and the corresponding mean intensities are marked with circles. Core 1 (with small observational mass bias) is marked with black and core 2 (with large observational mass bias) with red colour. For true SEDs: T = true mean temperature of dust grains, β = true spectral index = 2.1, N = true mean column density for the core area. For observed SEDs: T = temperature (given by fit), β = spectral index (given by fit), N = observed mean column density for the core area.
Current usage metrics show cumulative count of Article Views (full-text article views including HTML views, PDF and ePub downloads, according to the available data) and Abstracts Views on Vision4Press platform.
Data correspond to usage on the plateform after 2015. The current usage metrics is available 48-96 hours after online publication and is updated daily on week days.
Initial download of the metrics may take a while.