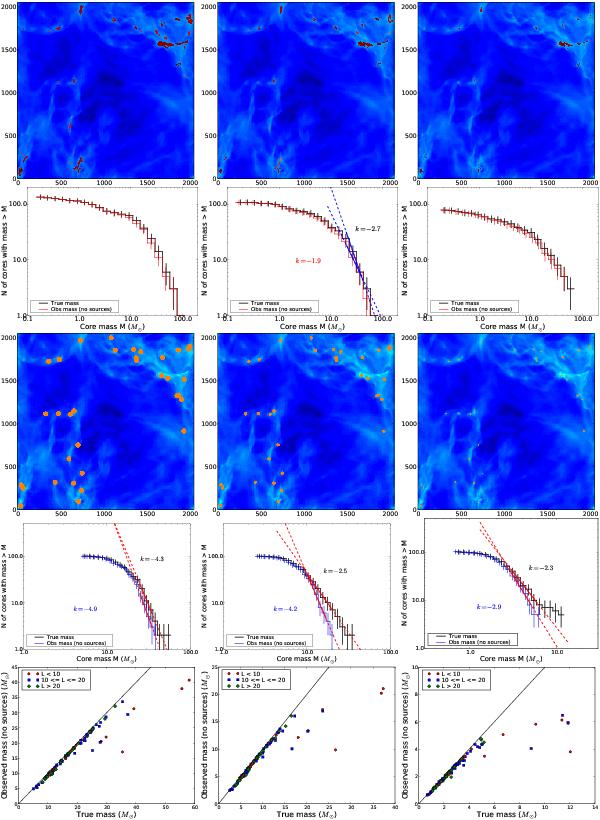
Fig. 7

The comparison of Model II mass estimates obtained with different methods. The analysis was performed with surface brightness maps at 250 μm and 500 μm and an assumed cloud distance of 100 pc. Rows 1–2: the clump maps and mass spectra obtained with three different scaling factors for the rms noise. In the map the discovered clumps are drawn in red. The mass spectra are plotted using both the observed masses derived from the simulated observations (red line) and the true masses (but identical clumps) obtained from the cloud model. Rows 3–4: the results of similar analysis using areas within a fixed radius around the positions of gravitationally bound cores. The radius was 30 (leftmost frames), 20, or 10 pixels. The observed mass spectra is drawn with blue line in the electronic article in order to make a difference between the mass spectra obtained with Clumpfind clumps. Row 5: relations of observed mass vs. true mass for the fixed radius environments. L denotes the luminosity of the sources that are later added in the cores and is related to the mass of the original 3D clump. Here it acts only as an identifier for the masses of the cores. The clump areas are shown in only one direction, but in the mass spectra and observed mass vs. true mass plots clumps in all three directions are included. The slope (k) of some of the mass spectra is obtained by making a least squares fit to the linear part (marked with continuous line). Note that in middle frame on row 2 there is not a proper linear part. The slope values are very sensitive to the fitting interval.
Current usage metrics show cumulative count of Article Views (full-text article views including HTML views, PDF and ePub downloads, according to the available data) and Abstracts Views on Vision4Press platform.
Data correspond to usage on the plateform after 2015. The current usage metrics is available 48-96 hours after online publication and is updated daily on week days.
Initial download of the metrics may take a while.


