Fig. 6
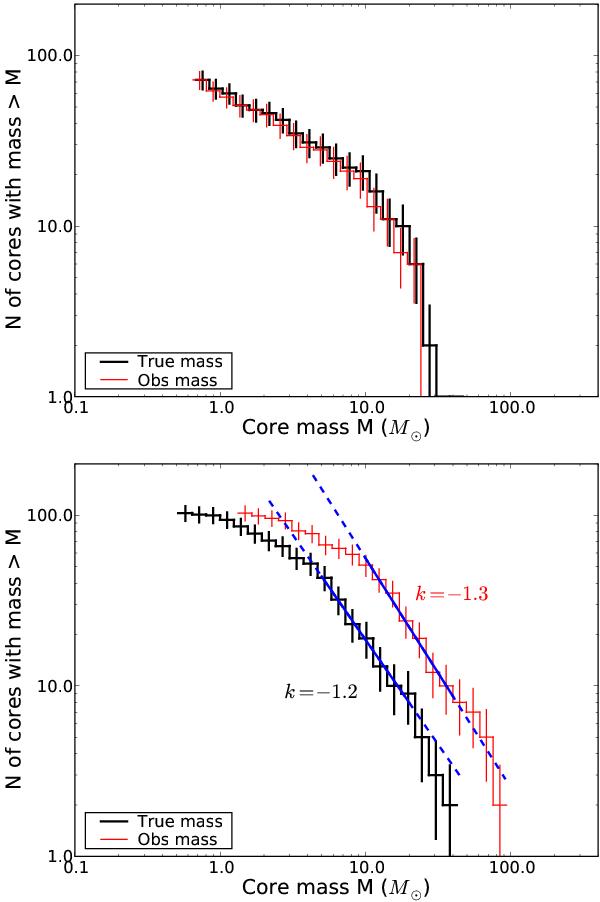
Model I: cumulative mass spectra (with Clumpfind clumps) obtained with normal dust (top frame) and a modified dust model (bottom frame; see text). The analysis was carried out with observations at 250 μm and 500 μm and an assumed cloud distance of 400 pc. The slope (k) of the mass spectra is obtained by making a least squares fit to the linear part (marked with continuous line).


Current usage metrics show cumulative count of Article Views (full-text article views including HTML views, PDF and ePub downloads, according to the available data) and Abstracts Views on Vision4Press platform.
Data correspond to usage on the plateform after 2015. The current usage metrics is available 48-96 hours after online publication and is updated daily on week days.
Initial download of the metrics may take a while.