Free Access
Fig. 2
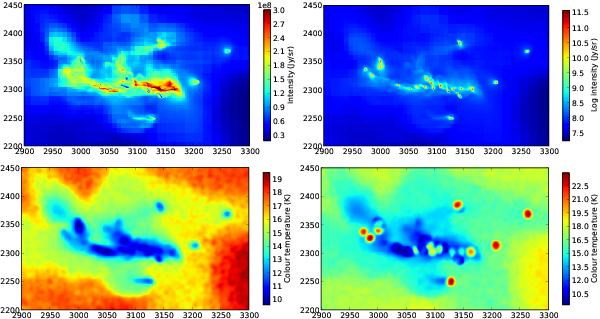
Closeups of the 250 μm intensity (top row) and colour temperature (bottom row) maps of Model III. The maps are shown before the addition of the internal radiation sources (left frames) and with the sources (right frames). The colour temperature was calculated from the ratio of 250 μm and 500 μm surface brightness.
This figure is made of several images, please see below:


Current usage metrics show cumulative count of Article Views (full-text article views including HTML views, PDF and ePub downloads, according to the available data) and Abstracts Views on Vision4Press platform.
Data correspond to usage on the plateform after 2015. The current usage metrics is available 48-96 hours after online publication and is updated daily on week days.
Initial download of the metrics may take a while.