Fig. 17
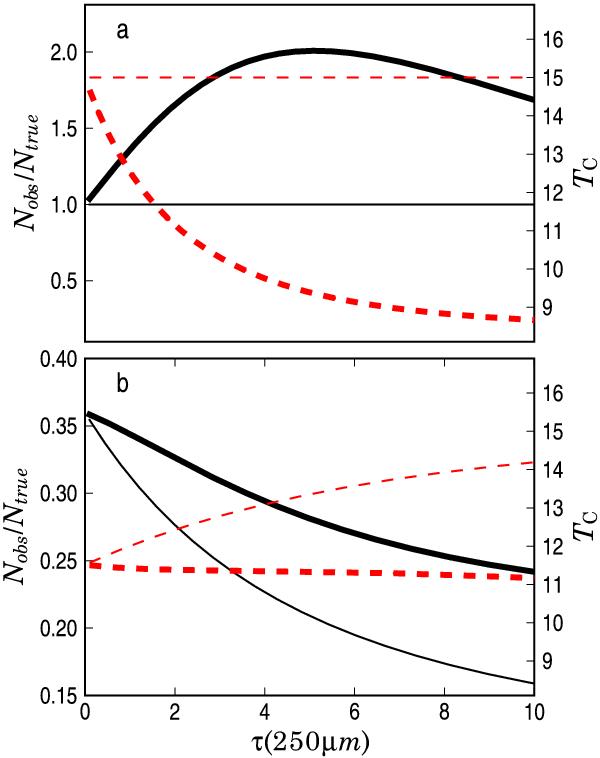
Comparison of colour temperature (TC, dashed lines) and the ratio of estimated and true column densities (solid lines) obtained from observations at 250 μm and 500 μm. The thick lines correspond to the optically thin approximation (cf. Eq. (1)) and the thin lines to the values obtained by fitting Iν = Bν(TC)(1 − exp(− κN)). Frame a) shows the results for a homogeneous model with a dust temperature of 15 K. In frame b) the model consists of two homogeneous slabs, with temperatures of 7 K and 15 K (see text for details). On the horizontal axis is the total opacity of the model cloud at 250 μm. The figure shows that while the exact formula gives correct values for a homogeneous model, it results in larger underestimation of column densities in case of the two layer model.
Current usage metrics show cumulative count of Article Views (full-text article views including HTML views, PDF and ePub downloads, according to the available data) and Abstracts Views on Vision4Press platform.
Data correspond to usage on the plateform after 2015. The current usage metrics is available 48-96 hours after online publication and is updated daily on week days.
Initial download of the metrics may take a while.