Fig. 16
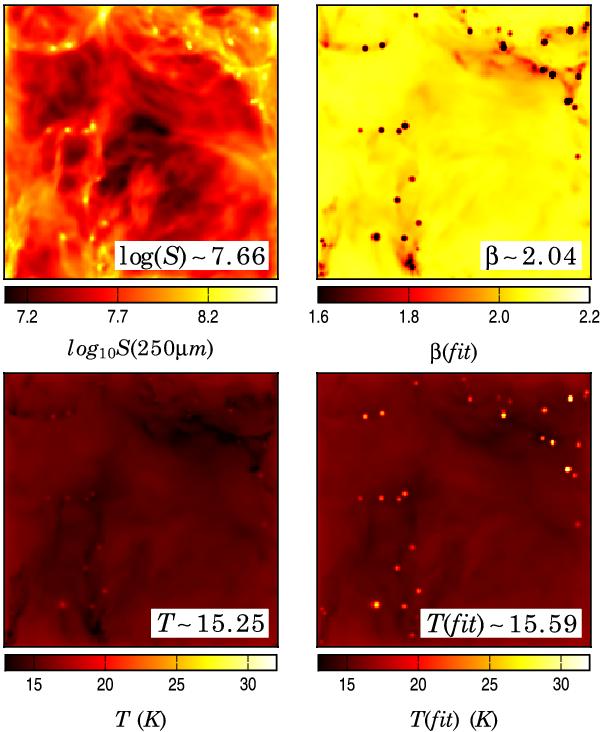
Results of the (Tdust, β)-fits for Model II with internal sources. The frames on the top row show the 250 μm surface brightness and the derived spectral indices. The lower frames show the mass averaged line-of-sight dust temperature and the estimated colour temperature. The median value of the variables are quoted in the frames.
Current usage metrics show cumulative count of Article Views (full-text article views including HTML views, PDF and ePub downloads, according to the available data) and Abstracts Views on Vision4Press platform.
Data correspond to usage on the plateform after 2015. The current usage metrics is available 48-96 hours after online publication and is updated daily on week days.
Initial download of the metrics may take a while.