Fig. 15
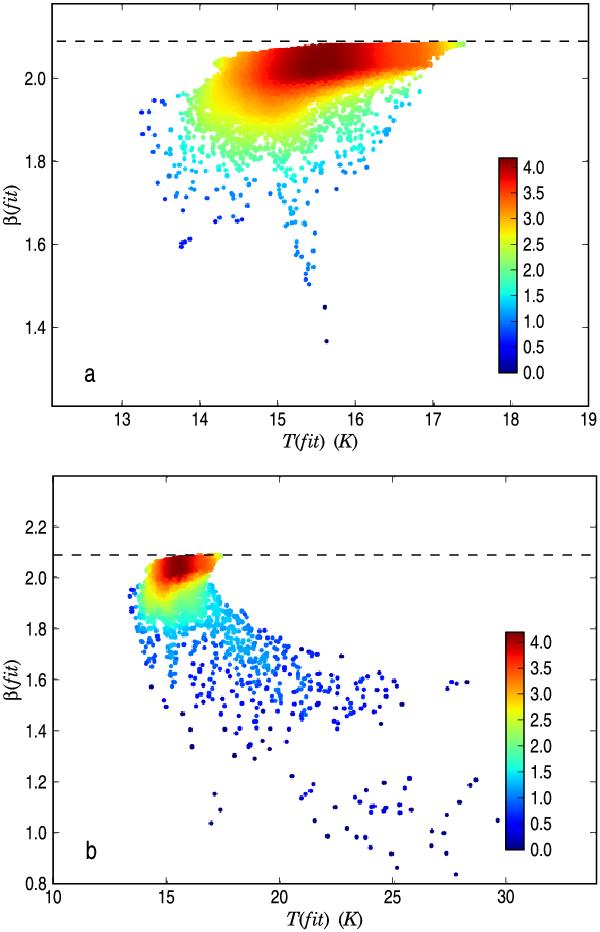
The correlation between the dust colour temperature and the spectral index as derived from the synthetic observations of Model II without internal sources (top frame) and with the internal heating sources (bottom frame). The colour scale indicates the logarithmic density of the (T, β) points and the dashed line the average spectral index in the dust model over the wavelength range used, 100 − 500 μm.
Current usage metrics show cumulative count of Article Views (full-text article views including HTML views, PDF and ePub downloads, according to the available data) and Abstracts Views on Vision4Press platform.
Data correspond to usage on the plateform after 2015. The current usage metrics is available 48-96 hours after online publication and is updated daily on week days.
Initial download of the metrics may take a while.