Fig. 14
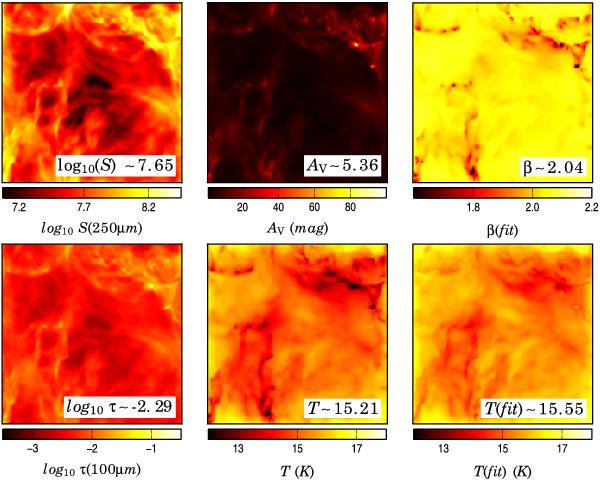
Results of the estimation of dust temperature and spectral index β in Model II. The frames on the top row show the 250 μm surface brightness, the visual extinction, and the estimated spectral indices. On the bottom row are the logarithm of the 100 μm optical depth, the real mass averaged dust temperature along the line-of-sight, and the estimated colour temperature. The median values of the variables are given in the frames.
Current usage metrics show cumulative count of Article Views (full-text article views including HTML views, PDF and ePub downloads, according to the available data) and Abstracts Views on Vision4Press platform.
Data correspond to usage on the plateform after 2015. The current usage metrics is available 48-96 hours after online publication and is updated daily on week days.
Initial download of the metrics may take a while.