Fig. 4
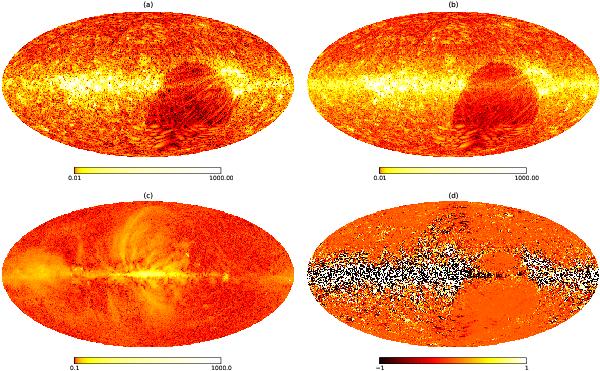
Results of the calculation of the gradient field G and the application of the LITMUS test. The first row shows estimates for the absolute values of the field G. Panel a) shows G as calculated directly from the posterior mean m of the signal field, whereas panel b) takes into account large-scale uncertainty corrections as described in Sect. 3.2.3. Panel c) shows the absolute value of the polarized intensity P as measured by the WMAP satellite and panel d) shows the result of the LITMUS test, namely Re(GP∗), in arbitrary units, using G and P as shown in panels b) and c), respectively. Note the logarithmic color code of panels a)–c).
Current usage metrics show cumulative count of Article Views (full-text article views including HTML views, PDF and ePub downloads, according to the available data) and Abstracts Views on Vision4Press platform.
Data correspond to usage on the plateform after 2015. The current usage metrics is available 48-96 hours after online publication and is updated daily on week days.
Initial download of the metrics may take a while.