Free Access
Fig. 3
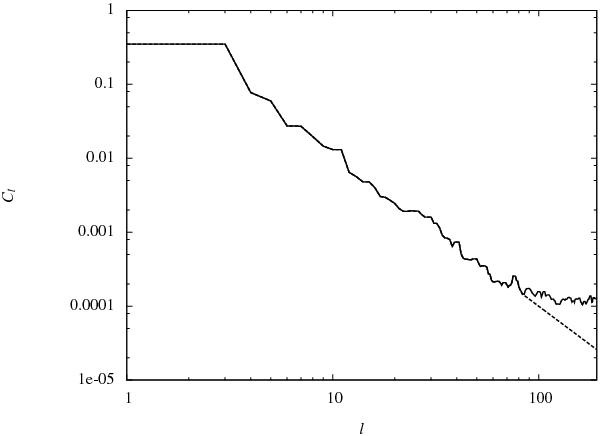
Angular power spectrum of the signal field s. The solid curve shows the resulting power spectrum as calculated with the critical filter formalism. The dashed line depicts the signal power spectrum used to generate large-scale uncertainty corrections for the calculation of G according to Sect. 3.2.3.
Current usage metrics show cumulative count of Article Views (full-text article views including HTML views, PDF and ePub downloads, according to the available data) and Abstracts Views on Vision4Press platform.
Data correspond to usage on the plateform after 2015. The current usage metrics is available 48-96 hours after online publication and is updated daily on week days.
Initial download of the metrics may take a while.