Free Access
Fig. 2
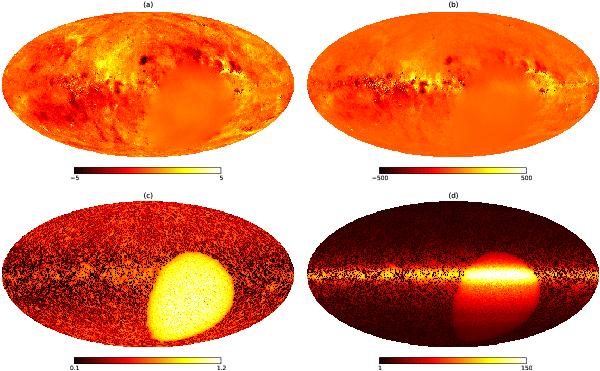
Results of the reconstruction of the signal field and Faraday depth. The left column shows the posterior mean of the signal field m (panel a)) and its one-sigma uncertainty  (panel c)). The right column shows the resulting map of the Faraday depth pm (panel b)) and the corresponding one-sigma uncertainty
  (panel d)) in m-2.
Current usage metrics show cumulative count of Article Views (full-text article views including HTML views, PDF and ePub downloads, according to the available data) and Abstracts Views on Vision4Press platform.
Data correspond to usage on the plateform after 2015. The current usage metrics is available 48-96 hours after online publication and is updated daily on week days.
Initial download of the metrics may take a while.