Fig. 5
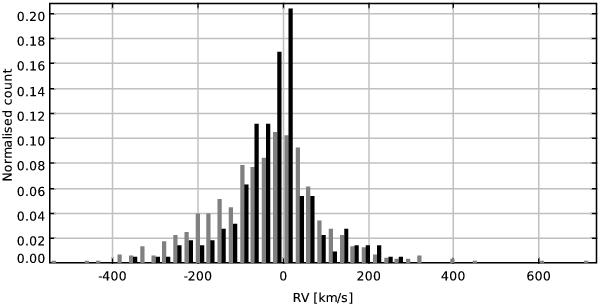
Radial velocity distribution of the hot subdwarf stars (see Fig. 4). The bright sample (g < 16.5 mag, black histogram) contains a mixture of stars from the disk and the halo population. The faint sample (g > 16.5 mag, grey histogram) contains the halo population. The peak in the bright subsample around zero RV is caused by the thin disk population. The asymmetry in the faint subsample where negative RVs are more numerous than positive ones may be due to the presence of large structures in the halo and the movement of the solar system relative to the halo.
Current usage metrics show cumulative count of Article Views (full-text article views including HTML views, PDF and ePub downloads, according to the available data) and Abstracts Views on Vision4Press platform.
Data correspond to usage on the plateform after 2015. The current usage metrics is available 48-96 hours after online publication and is updated daily on week days.
Initial download of the metrics may take a while.