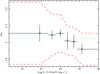
Fig. 9
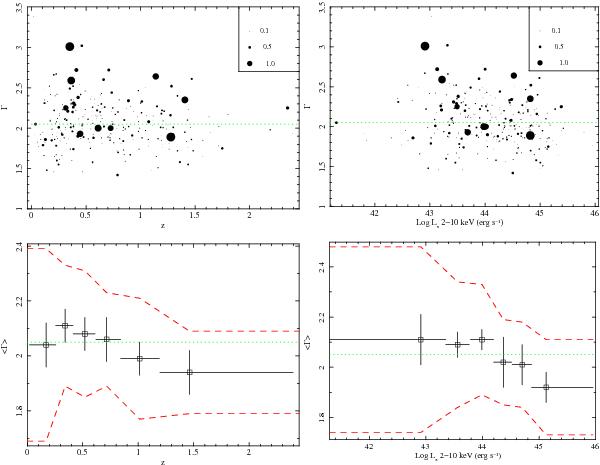
Top panel: type 1 AGN photon index versus redshift (left) and luminosity (right). The size of the circles indicates the size of the errors on the photon index. The horizontal dotted line corresponds to the average photon index for the whole sample. Bottom panel: type 1 AGN average photon index versus redshift (left) and luminosity (right) for the luminosity and redshift bins. The error bars correspond to the mean error at 1σ confidence level, whereas the dashed lines mark the values for the intrinsic dispersion at each bin.
Current usage metrics show cumulative count of Article Views (full-text article views including HTML views, PDF and ePub downloads, according to the available data) and Abstracts Views on Vision4Press platform.
Data correspond to usage on the plateform after 2015. The current usage metrics is available 48-96 hours after online publication and is updated daily on week days.
Initial download of the metrics may take a while.