Fig. 8
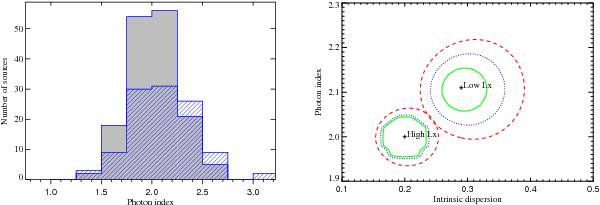
Left panel: photon index distribution corresponding to the low-luminosity (dashed histogram) and the high-luminosity (filled histogram) subsamples. Right panel: computed mean and intrinsic dispersion for the low- and high-luminosity subsamples along with the 1σ (solid line), 2σ (dotted line) and 3σ (dashed line) confidence contours.
Current usage metrics show cumulative count of Article Views (full-text article views including HTML views, PDF and ePub downloads, according to the available data) and Abstracts Views on Vision4Press platform.
Data correspond to usage on the plateform after 2015. The current usage metrics is available 48-96 hours after online publication and is updated daily on week days.
Initial download of the metrics may take a while.