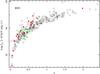
Fig. 1
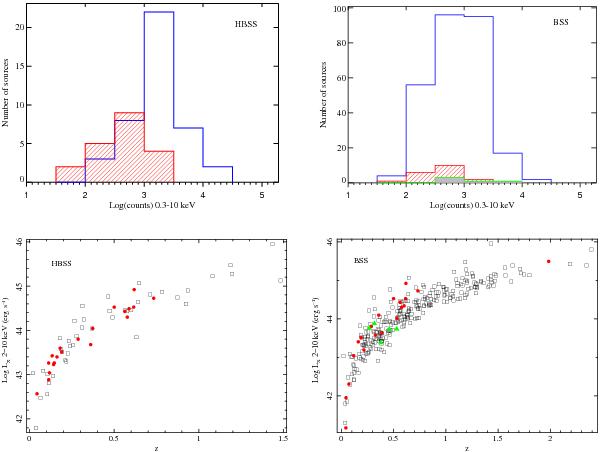
Top panels: counts distribution for the HBSS (left) and the BSS (right) samples. Empty histograms correspond to type 1 AGN and dashed histograms to type 2 AGN. Filled histogram for the BSS corresponds to BL Lacs. Bottom panels: X-ray intrinsic luminosity versus redshift for the HBSS (left) and the BSS (right). Squares and circles correspond to sources classified as type 1 and type 2 AGN, respectively. Triangles on the BSS sample represent BL Lacs.
Current usage metrics show cumulative count of Article Views (full-text article views including HTML views, PDF and ePub downloads, according to the available data) and Abstracts Views on Vision4Press platform.
Data correspond to usage on the plateform after 2015. The current usage metrics is available 48-96 hours after online publication and is updated daily on week days.
Initial download of the metrics may take a while.