Fig. 8
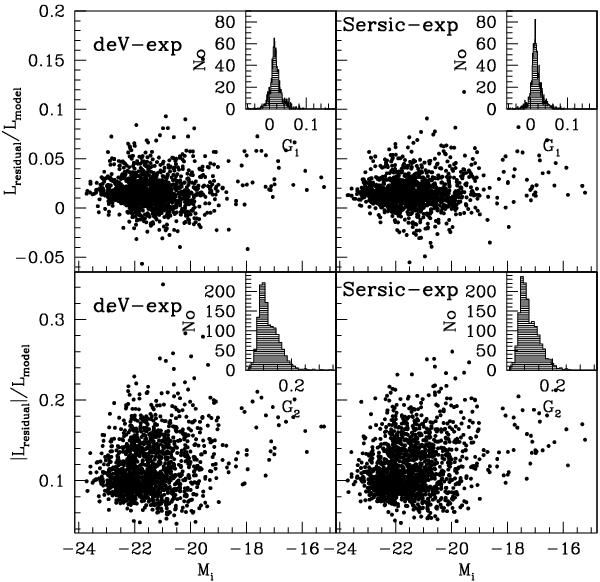
Goodness of fit measures for our two-component modelling of the i-band images. The two left-hand panels give results for the 1469 galaxies modelled successfully using a de Vaucouleurs profile for the bulge and an exponential profile for the disc. The two right-hand panels give results for the 1515 galaxies modelled successfully when we use the more general Sérsic profile for the bulge. The two upper panels show results for  , the total light in the residual image in units of the total light of the model. The two lower panels give results for
  , the sum of the absolute values of the individual pixel deviations from the model again in units of the total model luminosity. G1 and G2 are plotted against absolute magnitude in the main part of each panel while a histogram of their marginal distribution is given in the inset.
Current usage metrics show cumulative count of Article Views (full-text article views including HTML views, PDF and ePub downloads, according to the available data) and Abstracts Views on Vision4Press platform.
Data correspond to usage on the plateform after 2015. The current usage metrics is available 48-96 hours after online publication and is updated daily on week days.
Initial download of the metrics may take a while.