Fig. 4
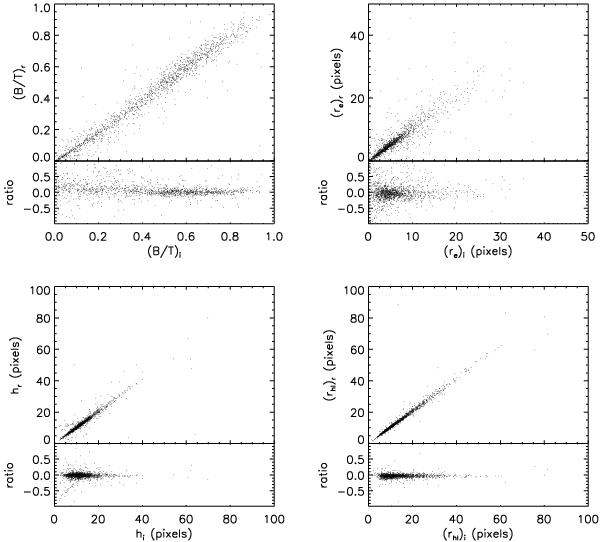
The bulge fraction (upper-left), the disc scalelength (lower-left), the effective radius of the bulge (upper-right) and the half-light radius of the galaxy (lower-right) in the i and r bands are plotted against each other for the 1638 galaxies (in the photometric sample) modelled in both bands by fitting a de Vaucouleurs profile to the bulge and an exponential to the disc.
Current usage metrics show cumulative count of Article Views (full-text article views including HTML views, PDF and ePub downloads, according to the available data) and Abstracts Views on Vision4Press platform.
Data correspond to usage on the plateform after 2015. The current usage metrics is available 48-96 hours after online publication and is updated daily on week days.
Initial download of the metrics may take a while.