Free Access
Fig. 2
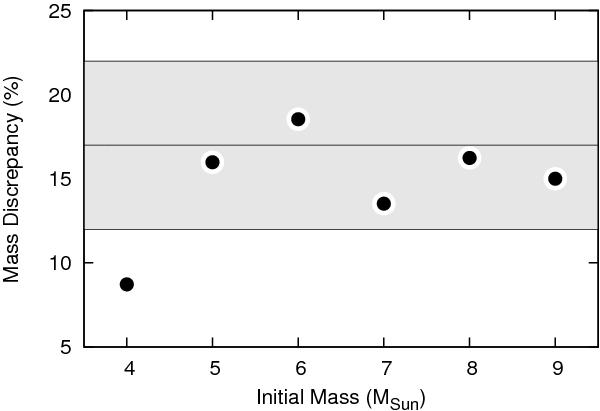
Predicted mass difference due to αc = 0.335 and pulsation-driven mass loss as a function of initial stellar mass. The horizontal lines and gray region represent the average mass discrepancy found by Keller (2008).
Current usage metrics show cumulative count of Article Views (full-text article views including HTML views, PDF and ePub downloads, according to the available data) and Abstracts Views on Vision4Press platform.
Data correspond to usage on the plateform after 2015. The current usage metrics is available 48-96 hours after online publication and is updated daily on week days.
Initial download of the metrics may take a while.