Fig. 2
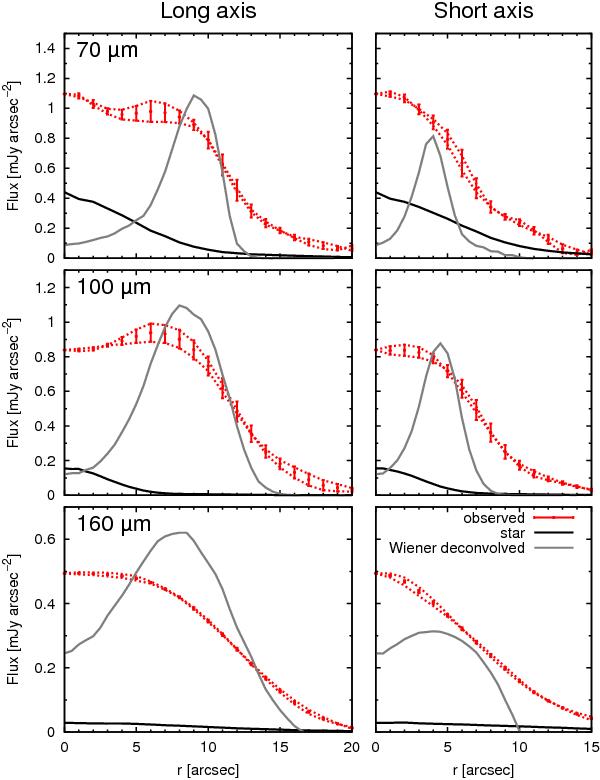
Radial profiles of HD 207129 along the semi-major (left) and semi-minor (right) axes of the disc. The red dotted lines are the measured profile either side of the disc centre along each axis; the solid red error bars mark the mean position at each point and the associated uncertainty. The grey line is the deconvolved disc profile and the black line is the subtracted stellar profile.
Current usage metrics show cumulative count of Article Views (full-text article views including HTML views, PDF and ePub downloads, according to the available data) and Abstracts Views on Vision4Press platform.
Data correspond to usage on the plateform after 2015. The current usage metrics is available 48-96 hours after online publication and is updated daily on week days.
Initial download of the metrics may take a while.