Fig. 1
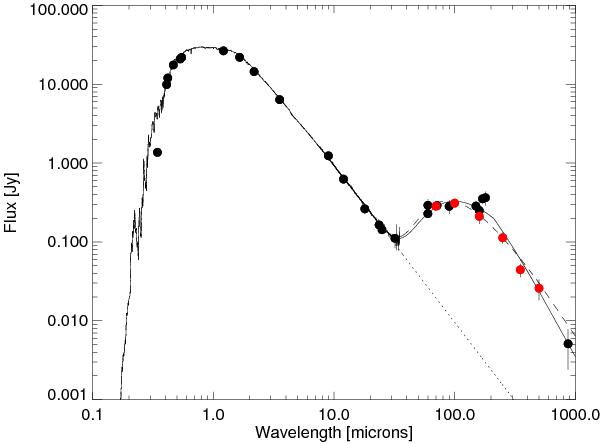
HD 207129 spectral energy distribution. Red data points are the PACS and SPIRE photometry, black data points are the ancillary data, including the Spitzer IRS spectrum. Error bars are 1 σ and include both calibration uncertainty (10% for 70/100 μm, 20% for 160 μm) and sky noise. Some error bars are smaller than the data point symbol. For wavelengths longer than ~30 μm the solid line represents a disc model with a λ0 = 210 μm and β = 1, the dashed line represents a disc model with a λ0 = 63 μm and β = 2.7 and the dotted line represent the stellar photosphere.
Current usage metrics show cumulative count of Article Views (full-text article views including HTML views, PDF and ePub downloads, according to the available data) and Abstracts Views on Vision4Press platform.
Data correspond to usage on the plateform after 2015. The current usage metrics is available 48-96 hours after online publication and is updated daily on week days.
Initial download of the metrics may take a while.