Fig. 4
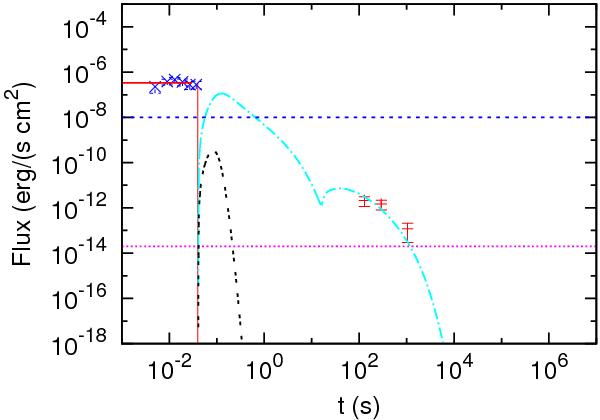
Our numerical simulation within scenario 2, assuming that the extended afterglow is energetically predominant over the P-GRB. In this case, the predicted P-GRB (solid rectangle) is less then twice the extended afterglow. We interpret the BAT data (crosses) as the P-GRB and the XRT data as the extended afterglow. The P-GRB has just 28% of the total energy. The double-dashed line is the theoretical light curve in the band 15–150 keV, and the dot-dashed line is the theoretical light curve in the band 0.3–10 keV. The two horizontal lines are from above to below: the BAT threshold and the XRT threshold.
Current usage metrics show cumulative count of Article Views (full-text article views including HTML views, PDF and ePub downloads, according to the available data) and Abstracts Views on Vision4Press platform.
Data correspond to usage on the plateform after 2015. The current usage metrics is available 48-96 hours after online publication and is updated daily on week days.
Initial download of the metrics may take a while.