Free Access
Fig. 2
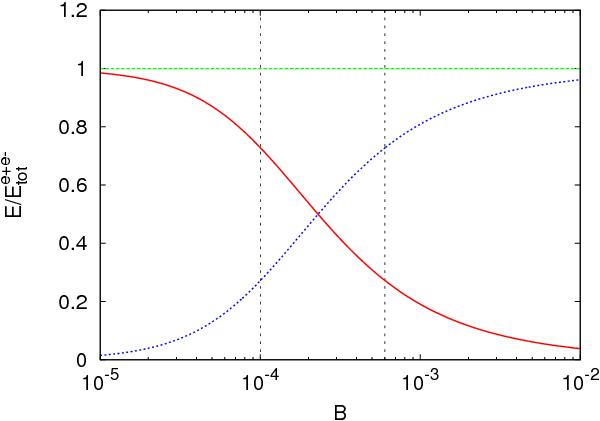
The dashed (blue) curve is the energy emitted in the extended afterglow, the solid (red) curve is the energy emitted in the P-GRB, their sum is  . From left to right, the first vertical line corresponds to the value of B = 1.0 × 10⁻⁴ of scenario 1, the second to the value of B = 6.0 × 10⁻⁴ of scenario 2 (see Sect. 3).
Current usage metrics show cumulative count of Article Views (full-text article views including HTML views, PDF and ePub downloads, according to the available data) and Abstracts Views on Vision4Press platform.
Data correspond to usage on the plateform after 2015. The current usage metrics is available 48-96 hours after online publication and is updated daily on week days.
Initial download of the metrics may take a while.