Fig. 1
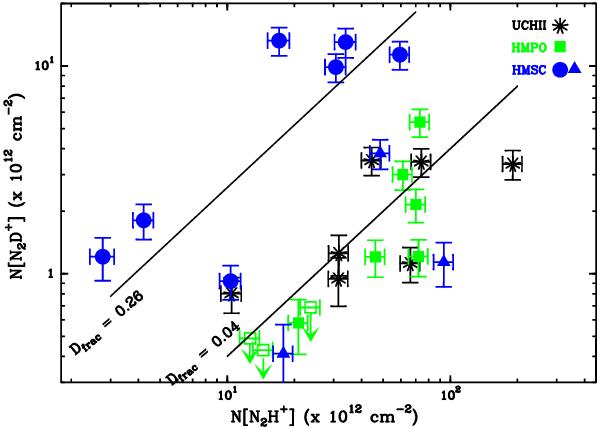
N2D+ column density versus N2H+ column density. Blue symbols correspond to HMSCs (triangles: “warm” cores, see text); green squares show HMPOs (open squares are upper limits); black asterisks correspond to UC HII regions. The two lines indicate the average values of Dfrac for the HMSC group (i.e. 0.26) and that of both the HMPO and UC HII groups (i.e. 0.04).
Current usage metrics show cumulative count of Article Views (full-text article views including HTML views, PDF and ePub downloads, according to the available data) and Abstracts Views on Vision4Press platform.
Data correspond to usage on the plateform after 2015. The current usage metrics is available 48-96 hours after online publication and is updated daily on week days.
Initial download of the metrics may take a while.