Fig. 3
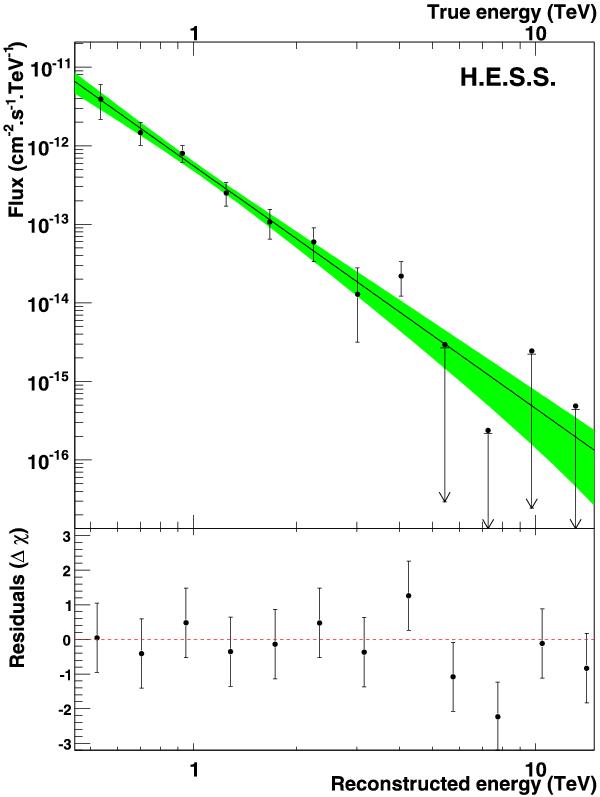
Time-averaged VHE spectrum observed from HESS J1943+213. The shaded area represents the 1σ confidence level of the fitted spectrum using a power-law hypothesis. Only the statistical errors are shown and the upper limits are 68% confidence level. The lower panel shows the residual of the spectrum fit, which are the difference, in each reconstructed energy bin, between expected and observed number of excess events, normalized to uncertainty on the latter ((Nobs − Nexp)/ΔNexp).
Current usage metrics show cumulative count of Article Views (full-text article views including HTML views, PDF and ePub downloads, according to the available data) and Abstracts Views on Vision4Press platform.
Data correspond to usage on the plateform after 2015. The current usage metrics is available 48-96 hours after online publication and is updated daily on week days.
Initial download of the metrics may take a while.