Fig. 4
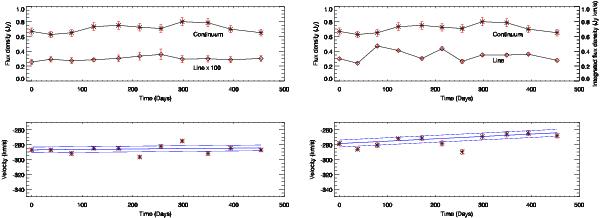
Left panels: continuum and line peak flux density vs. time (up) and peak velocity vs. time (bottom) for the spectra with a channel spacing of 2.4 km s-1. The peak flux density of the line has been multiplied by a factor of 100 to allow the comparison with the continuum flux density within the same plot. The error bars represent the rms noise levels per channel of the spectra and the width of the channels, respectively. Right panels: continuum and integrated flux density vs. time (up) and peak velocity vs. time (bottom) derived from Gaussian fitting. The error bars indicate the formal errors obtained from the fits. Best fit lines and mean absolute deviations are shown in blue. Day 0 is 2008 October 14–15.
Current usage metrics show cumulative count of Article Views (full-text article views including HTML views, PDF and ePub downloads, according to the available data) and Abstracts Views on Vision4Press platform.
Data correspond to usage on the plateform after 2015. The current usage metrics is available 48-96 hours after online publication and is updated daily on week days.
Initial download of the metrics may take a while.