Fig. 3
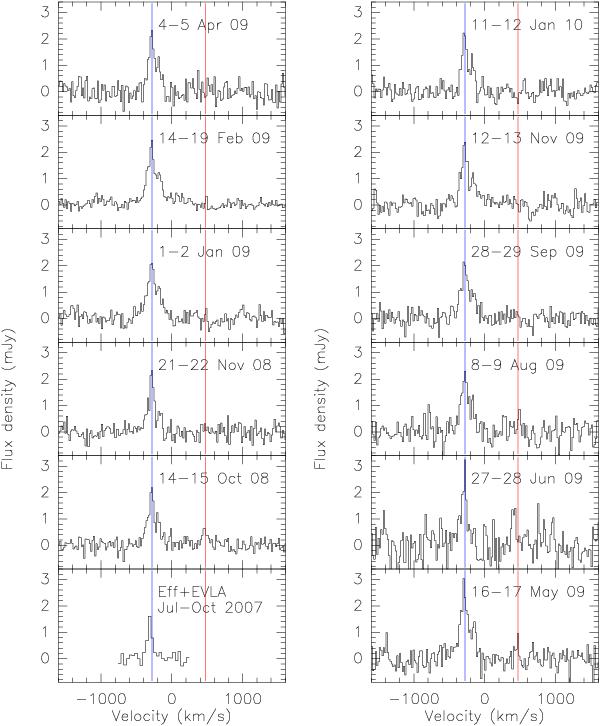
Water maser spectra observed towards MG J0414+0534 between July 2007 and January 2010. The first spectrum (bottom left corner) is the combined Effelsberg and EVLA spectrum (channel spacing 38.4 km s-1) obtained by observing 14+12 h on-source between July and October 2007 (for details, see Impellizzeri et al. 2008). The other spectra have been taken with Arecibo. The spectra shown here have been smoothed to a resolution of 19.2 km s-1. The blue and red vertical lines indicate the peak velocities of the main and satellite maser features, respectively, as measured in the October 2008 spectrum.
Current usage metrics show cumulative count of Article Views (full-text article views including HTML views, PDF and ePub downloads, according to the available data) and Abstracts Views on Vision4Press platform.
Data correspond to usage on the plateform after 2015. The current usage metrics is available 48-96 hours after online publication and is updated daily on week days.
Initial download of the metrics may take a while.