Fig. 2
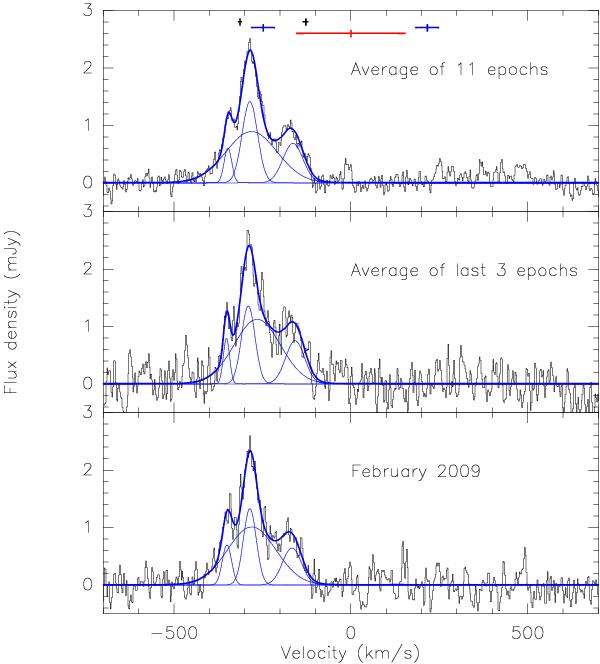
Lower panel: water maser spectrum of MG J0414+0534 observed in February 2009. Middle panel: average of the last three epochs (September and November 2009 and January 2010) obtained using equal weights. Upper panel: final spectrum produced by averaging all the epochs with the same weight. Individual Gaussian profiles fitted to the spectra are overlaid in blue together with the resulting profile. The red cross marks the systemic velocity and the associated uncertainty (see Sect. 4.1). The blue and the black crosses indicate the peaks of the CO emission (Barvainis et al. 1998) and the H i absorption components (Moore et al. 1999), respectively, with their errors. The channel spacing is 2.4 km s-1. The rms noise level is 0.2 mJy per channel in the spectra of the lower and middle panels and 0.1 mJy per channel in the upper panel.
Current usage metrics show cumulative count of Article Views (full-text article views including HTML views, PDF and ePub downloads, according to the available data) and Abstracts Views on Vision4Press platform.
Data correspond to usage on the plateform after 2015. The current usage metrics is available 48-96 hours after online publication and is updated daily on week days.
Initial download of the metrics may take a while.