Fig. 1
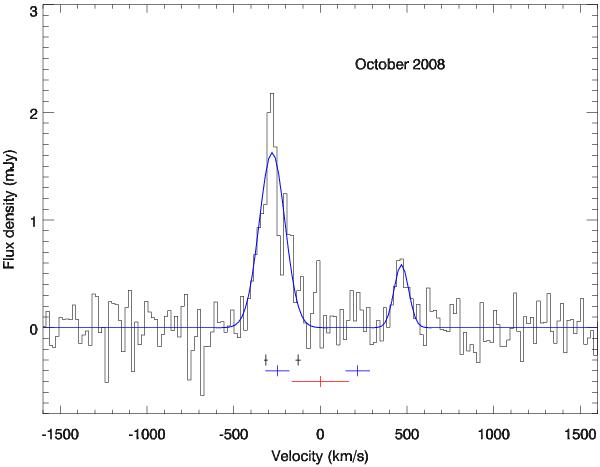
Water maser spectrum observed towards MG J0414+0534 in October 2008 (black histogram). The fitted Gaussian profiles are overlaid (blue line). The channel spacing is 19.2 km s-1. The root-mean-square (rms) noise level of the spectrum is 0.2 mJy per channel. The velocity scale is relative to redshift 2.639 (Lawrence et al. 1995) using the optical velocity definition in the heliocentric frame. The red cross marks the systemic velocity and the associated uncertainty (see Sect. 4.1). The blue and the black crosses indicate the peaks of the CO emission (Barvainis et al. 1998) and the H i absorption components (Moore et al. 1999), respectively, with their errors.
Current usage metrics show cumulative count of Article Views (full-text article views including HTML views, PDF and ePub downloads, according to the available data) and Abstracts Views on Vision4Press platform.
Data correspond to usage on the plateform after 2015. The current usage metrics is available 48-96 hours after online publication and is updated daily on week days.
Initial download of the metrics may take a while.