Fig. 5
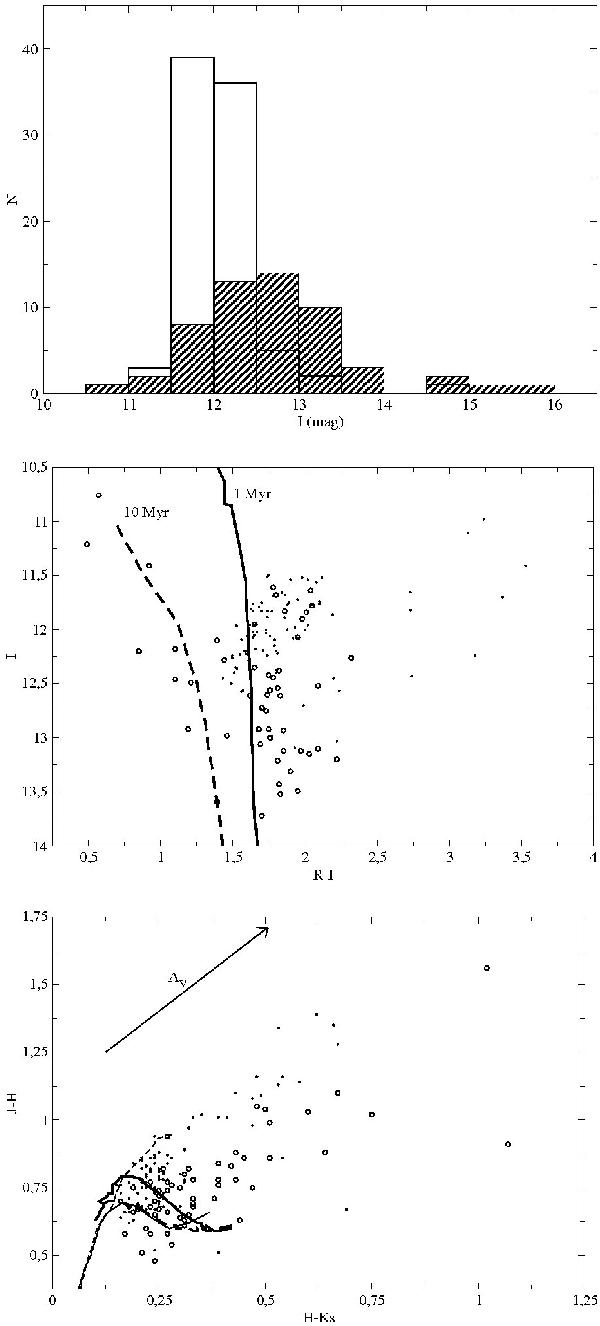
Photometric properties of the Lupus members and candidate members. Upper panel: I-magnitude distribution for Groups A and B (filled and blank histogram, respectively). Middle panel: (I, R − I) colour − magnitude diagram for the Lupus objects. Group A and Group B sources are indicated with open circles and dots, respectively. The thick solid and dashed lines are the 1 and 10 Myr isochrones, respectively, from the models by Baraffe et al. (1998). Lower panel: (J − H, H − Ks) colour − colour diagram for the Lupus objects. The thin dashed and solid lines correspond to the giant and dwarf loci, respectively, from Bessell & Brett (1988). An extinction vector of 5 mag according to the law by Cardelli et al. (1989) is also indicated. Other symbols as in the previous panel.
Current usage metrics show cumulative count of Article Views (full-text article views including HTML views, PDF and ePub downloads, according to the available data) and Abstracts Views on Vision4Press platform.
Data correspond to usage on the plateform after 2015. The current usage metrics is available 48-96 hours after online publication and is updated daily on week days.
Initial download of the metrics may take a while.