Fig. 3
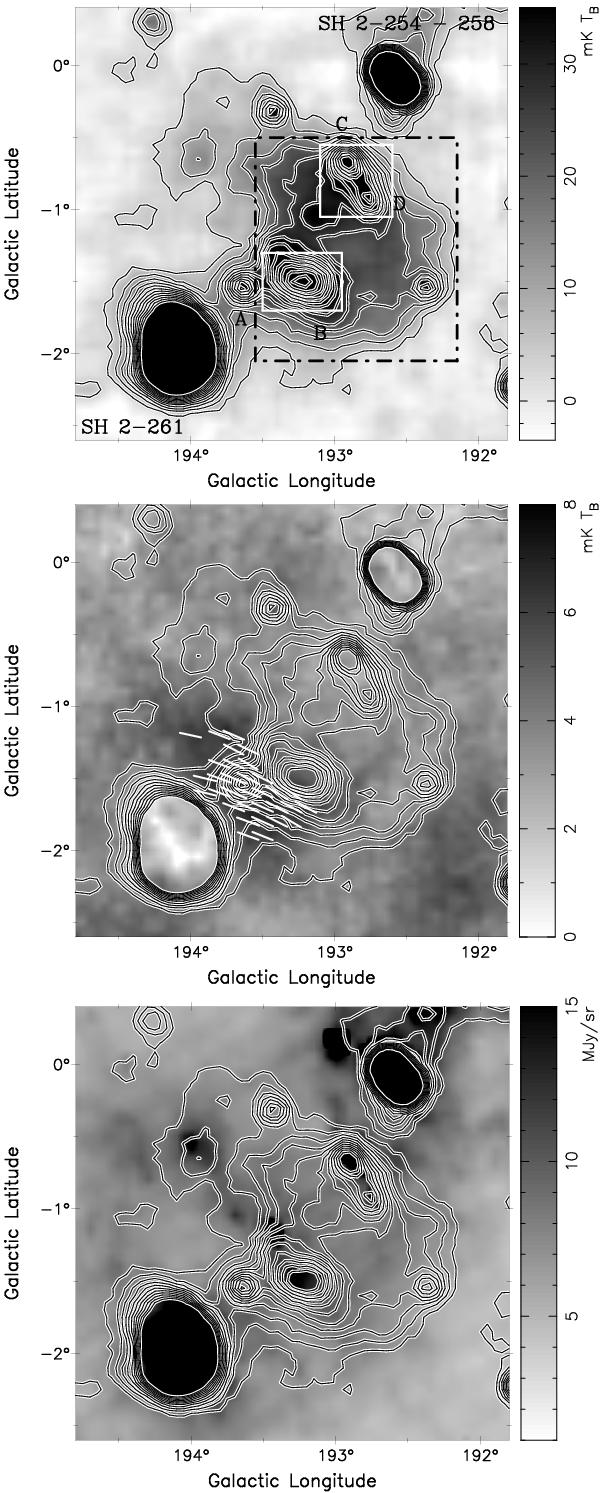
Top: total intensity (I) image at λ6 cm for G192.8−1.1 (PKS 0607+17) and its surroundings. The “background filtering” technique was used to remove large-scale emission. Contours start at 3.0 mK TB (3σ level) and run in steps of 5.0 mK TB. The big rectangle area includes the G192.8−1.1, which was used for the TT-plot analysis by excluding the two areas marked by white small rectangles. Middle: PI image of G192.8−1.1 area (PKS 0607+17) at λ6 cm. The same total intensity contours are overlaid as in the top plot. Bars are plotted for observed B-vectors (i.e. PA + 90°) at λ6 cm if  . Bottom: infrared image at 60 μm of the same area (Cao et al. 1997) overlaid by λ6 cm I contours.
Current usage metrics show cumulative count of Article Views (full-text article views including HTML views, PDF and ePub downloads, according to the available data) and Abstracts Views on Vision4Press platform.
Data correspond to usage on the plateform after 2015. The current usage metrics is available 48-96 hours after online publication and is updated daily on week days.
Initial download of the metrics may take a while.