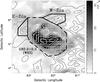
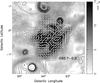
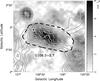
Fig. 1
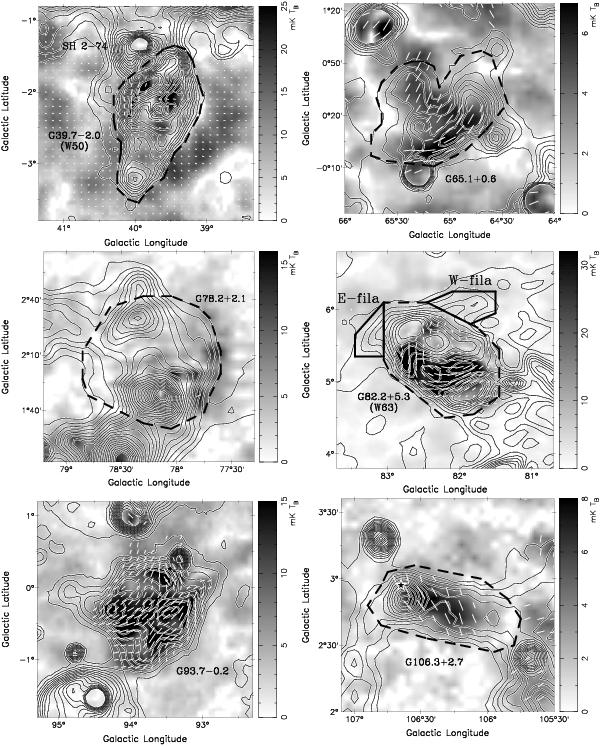
Polarization intensity (PI) in greyscale images overlaid by total intensity contours for 16 SNRs (more in next pages). Four of them, G69.0+2.7 (CTB 80), G89.0+4.7 (HB21), G160.9+2.6 (HB9), and G205.5+0.5 (Monoceros Nebula), are presented in page 5 by slightly larger plots. Observed polarization B-field vectors (i.e. PA of the observed E-vector plus 90°) of SNRs were overlaid every 6′ in case PI exceeds a certain threshold (see below). Their lengths are proportional to PI. The stars indicate the pulsar in G114.3+0.3 and pulsar wind nebula inside G106.3+2.7, G189.1+3.0 (IC 443) and CTB 80. The thick dashed line marks the boundary for flux density integration for G39.7−2.0 (W50), G65.1+0.6, G78.2+2.1, G82.2+5.3 (W63), G106.3+2.7, IC 443, CTB 80, and the western shell of the Monoceros Nebula. All contour lines run from the local 3σ level (see values for each SNR below) in different steps. The contour start level, contour step, and PI threshold for plotted B-vectors (all in mK TB) are for W50: 13.5, 13.5, 3.0; for G65.1+0.6: 3.9, 5.0, 4.0; for G78.2+2.1: 90.0, 120.0, 15.0; for W63: 9.0, 24.0, 8.0; for G93.7−0.2: 4.5, 12.0, 7.0; for G106.3+2.7: 6.0, 4.2, 3.2; for G114.3+0.3: 4.0, 4.0, 3.8; for G116.5+1.1: 3.6, 4.5, 7.0; for G166.0+4.3 (VRO 42.05.01): 2.1, 5.0, 3.5; for G179.0+2.6: 1.5, 3.5, 2.5; for G206.9+2.3 (PKS 0646+06): 3.0, 4.5, 3.0 for HB21: 3.3, 34.0, 7.5; for HB9: 3.0, 7.5, 7.0. For the Monoceros Nebula: 4.0, 6.0, 4.5. For IC 443, contours start at 7.2 mK TB and run in steps of 2n − 1 × 4.8 mK TB (n = 1,2,3,...), the PI threshold is 7.0 mK TB. For CTB 80, contours start at 3.3 mK TB and run in steps of  , and the PI threshold is 10.0 mK TB.
Current usage metrics show cumulative count of Article Views (full-text article views including HTML views, PDF and ePub downloads, according to the available data) and Abstracts Views on Vision4Press platform.
Data correspond to usage on the plateform after 2015. The current usage metrics is available 48-96 hours after online publication and is updated daily on week days.
Initial download of the metrics may take a while.