Fig. 6
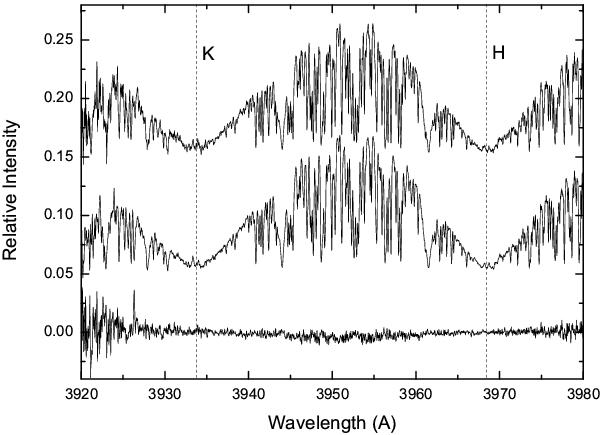
The spectral region of the Ca II H & K lines in α Ari. Two spectra exhibiting the positive (top) and the negative (middle) RV deviations are displayed (see text). Bottom shows the differential spectrum. Any systematic difference in line profiles and core reversals are not apparent around the Ca II H & K central region, indicating modest activity.
Current usage metrics show cumulative count of Article Views (full-text article views including HTML views, PDF and ePub downloads, according to the available data) and Abstracts Views on Vision4Press platform.
Data correspond to usage on the plateform after 2015. The current usage metrics is available 48-96 hours after online publication and is updated daily on week days.
Initial download of the metrics may take a while.