Fig. 9
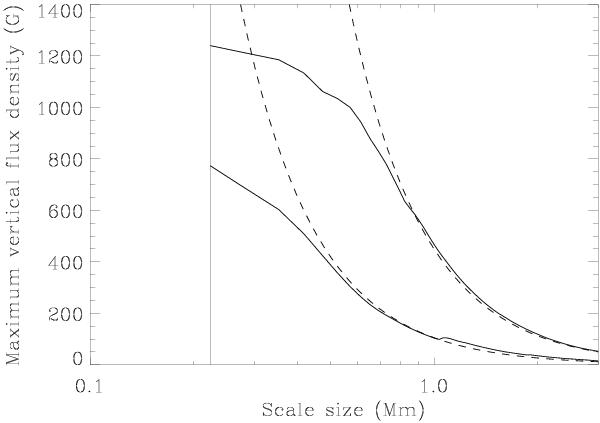
Illustration of the scaling behavior of the largest positive (upper solid curve) and negative (lower solid curve) flux density, representing the extreme right and left points of the Stokes V scatter plots after conversion to G units. d is the scale size of the smoothing window, as defined in the text. The dashed curves represent 1/d2 fits to the tails of the solid curves, demonstrating that the extreme V polarizations represent isolated flux density concentrations with sizes below 1 Mm. The thin vertical solid line marks the Hinode resolution scale.
Current usage metrics show cumulative count of Article Views (full-text article views including HTML views, PDF and ePub downloads, according to the available data) and Abstracts Views on Vision4Press platform.
Data correspond to usage on the plateform after 2015. The current usage metrics is available 48-96 hours after online publication and is updated daily on week days.
Initial download of the metrics may take a while.