Fig. 8
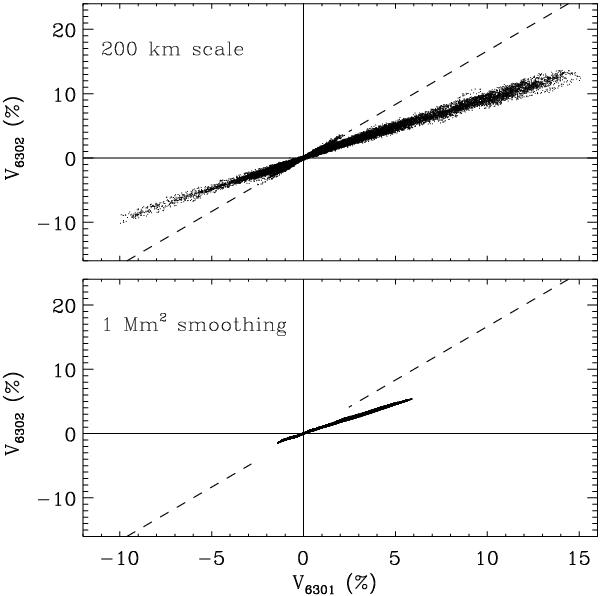
Scatter plots of V6302 vs. V6301 for the Hinode deep mode data set. The top panel shows the plot for all pixels at the original Hinode resolution (same as Fig. 8 of Stenflo 2010), while the bottom panel shows what happens after the same data set has been spatially smoothed with a window of area 1 Mm2. If the magnetic fields were intrinsically weak (less than a few hundred G), the points would fall along the dashed line.
Current usage metrics show cumulative count of Article Views (full-text article views including HTML views, PDF and ePub downloads, according to the available data) and Abstracts Views on Vision4Press platform.
Data correspond to usage on the plateform after 2015. The current usage metrics is available 48-96 hours after online publication and is updated daily on week days.
Initial download of the metrics may take a while.