Fig. 7
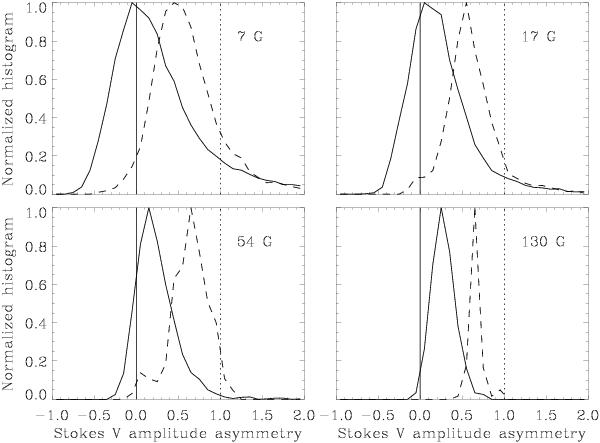
Normalized histograms of the Stokes V amplitude asymmetries for different bins in the vertical flux density, centered around 7, 17, 54, and 130 G. The same brightness masking as used for Fig. 1 has been applied. Thus the solid curves represent the darkest areas (intergranular lanes), the dashed curves the brightest areas (cell interiors). The vertical solid line marks zero asymmetry, to the left of which the red V lobe dominates, while the blue lobe dominates to the right. The dotted vertical line marks an asymmetry of unity. To the right of this line both lobes have the same sign.
Current usage metrics show cumulative count of Article Views (full-text article views including HTML views, PDF and ePub downloads, according to the available data) and Abstracts Views on Vision4Press platform.
Data correspond to usage on the plateform after 2015. The current usage metrics is available 48-96 hours after online publication and is updated daily on week days.
Initial download of the metrics may take a while.