Fig. 4
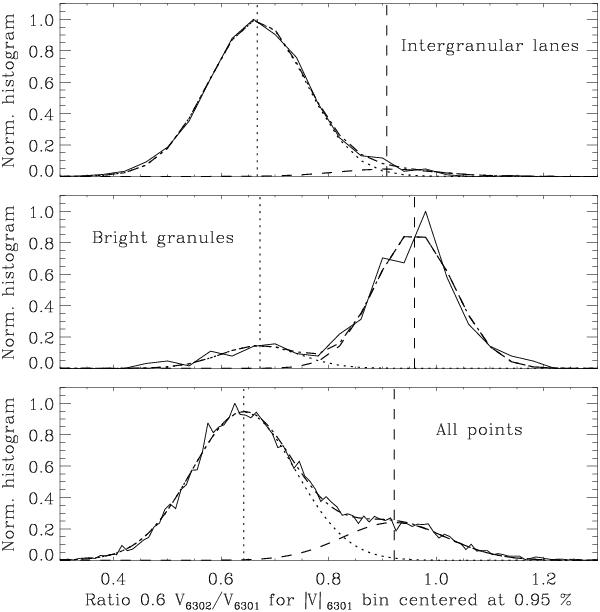
Histogram distributions (solid curves) for the Stokes V line ratio along a vertical cut through the scatter-plot diagrams within a |V|6301 bin centered at 0.95% polarization. The dashed-dotted curves represent 2-component Gaussian decompositions, with each Gaussian given by the dotted and dashed curves. The center positions of the two Gaussians are marked by the vertical dotted and dashed lines. The top and middle panels are derived from the top and bottom scatter plots of Fig. 1, while the bottom panel represents the case with no masking.
Current usage metrics show cumulative count of Article Views (full-text article views including HTML views, PDF and ePub downloads, according to the available data) and Abstracts Views on Vision4Press platform.
Data correspond to usage on the plateform after 2015. The current usage metrics is available 48-96 hours after online publication and is updated daily on week days.
Initial download of the metrics may take a while.