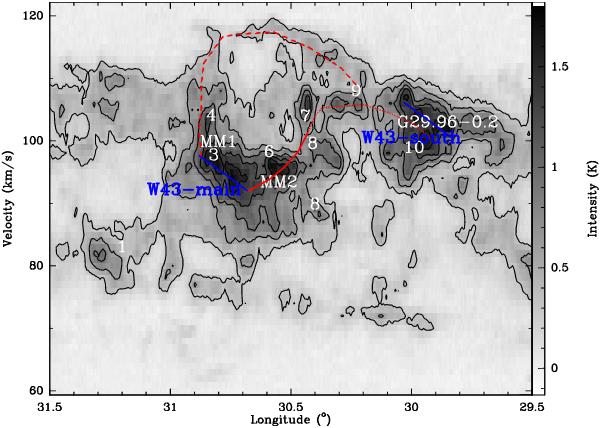
Fig. 6

The position-velocity diagram of the 13CO 1–0 line summed over the whole W43 latitude range (−0.5° to 0.3°) and plotted against its longitude. Contours go from to 0.4 to 2.0 by 0.4 K. The two most prominent structures, W43-main and W43-south, appear to be linked by lower density clouds. The two main bridges identified between W43-main and W43-south (blue bars) are outlined by red curves which are continuous when they correspond to filaments clearly identified by Motte et al. (in prep.) and dashed or dotted for weaker clouds connections. The location of a few 870 μm continuum peaks and reference sources are also indicated.
Current usage metrics show cumulative count of Article Views (full-text article views including HTML views, PDF and ePub downloads, according to the available data) and Abstracts Views on Vision4Press platform.
Data correspond to usage on the plateform after 2015. The current usage metrics is available 48-96 hours after online publication and is updated daily on week days.
Initial download of the metrics may take a while.


