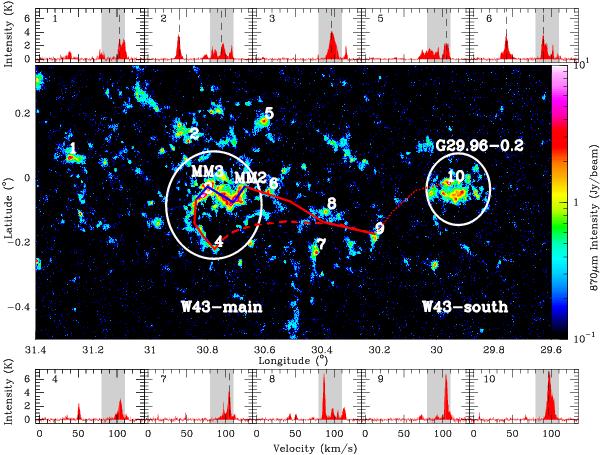
Fig. 4

870 μm continuum emission (color scale) and 13CO 1–0 line spectra observed toward a few bright 870 μm continuum peaks. In the panels showing spectra taken toward the numbered positions in the image, the main velocity range of W43 (80−110 km s-1) is indicated with gray filling, while dashed lines mark the NH3 peak velocities (Wienen et al., in prep.). In the image, the two main bridges identified between W43-main and South (blue bars) are outlined by red curves, which are continuous when they correspond to 13CO 1–0 filaments clearly identified by Motte et al. (in prep.) and dashed or dotted for more tentative connections. W43-MM1, W43-MM2, and G29.96-0.2 are indicated as reference points. The white circles indicate W43-main and W43-south, their areas are used to integrate the spectra of Fig. 2.
Current usage metrics show cumulative count of Article Views (full-text article views including HTML views, PDF and ePub downloads, according to the available data) and Abstracts Views on Vision4Press platform.
Data correspond to usage on the plateform after 2015. The current usage metrics is available 48-96 hours after online publication and is updated daily on week days.
Initial download of the metrics may take a while.


