Free Access
Fig. 3
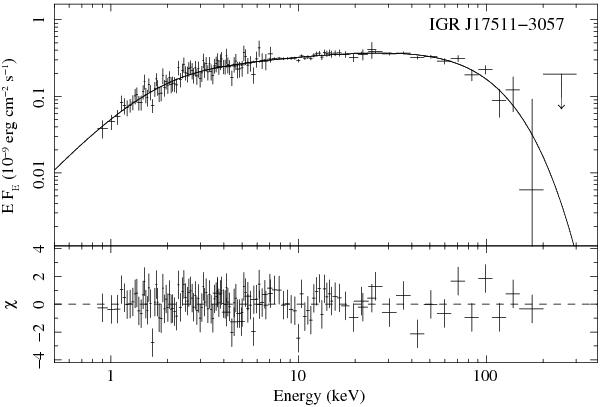
Unfolded broad-band spectrum of IGR J17511-3057 fit with the thermal Comptonization model compps. The data points are from XRT (0.8–7 keV), PCA (3–22 keV), and ISGRI (20–300 keV) spectra, respectively. The total model spectrum is shown by a solid line. The lower panel shows the residual between the data and the model.
Current usage metrics show cumulative count of Article Views (full-text article views including HTML views, PDF and ePub downloads, according to the available data) and Abstracts Views on Vision4Press platform.
Data correspond to usage on the plateform after 2015. The current usage metrics is available 48-96 hours after online publication and is updated daily on week days.
Initial download of the metrics may take a while.