Fig. 5
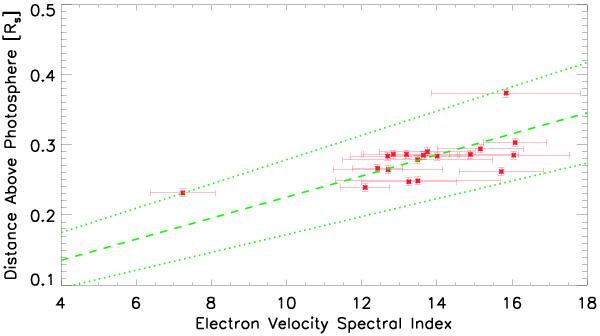
Scatter plot of electron beam spectral index in velocity space, α, calculated from the HXR photon spectral index vs. the distance above the photosphere associated with the starting frequencies of the type III burst. The one sigma observational errors on both spectral index and height are shown. The green dashed line is a linear fit to the data including observational error with the green dotted lines showing the extremes of the fit.
Current usage metrics show cumulative count of Article Views (full-text article views including HTML views, PDF and ePub downloads, according to the available data) and Abstracts Views on Vision4Press platform.
Data correspond to usage on the plateform after 2015. The current usage metrics is available 48-96 hours after online publication and is updated daily on week days.
Initial download of the metrics may take a while.