Fig. 2
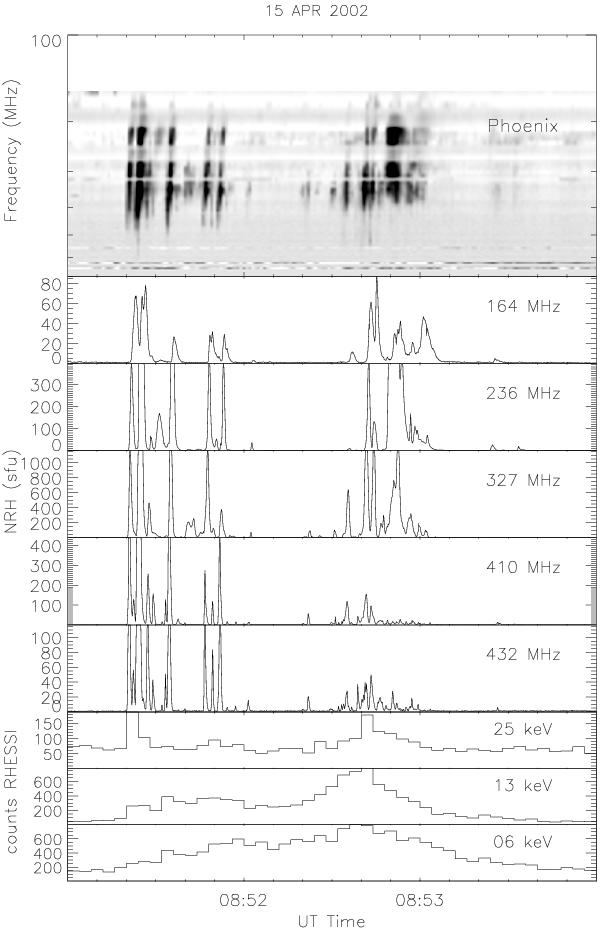
Time evolution of the radio and HXR fluxes for the April 15, 2002 solar flare between 08:51 and 08:54 UT. The top panel is the Phoenix-2 radiospectrometer data on a log scale between the frequencies 160 and 700 MHz. The middle panel is the Nançay radioheliograph flux time profiles observed at 5 discrete frequencies from 164 to 432 MHz. The bottom panels are the RHESSI HXR counts/second at the three energy ranges 6−12, 12−25 and 25−50 keV.
Current usage metrics show cumulative count of Article Views (full-text article views including HTML views, PDF and ePub downloads, according to the available data) and Abstracts Views on Vision4Press platform.
Data correspond to usage on the plateform after 2015. The current usage metrics is available 48-96 hours after online publication and is updated daily on week days.
Initial download of the metrics may take a while.